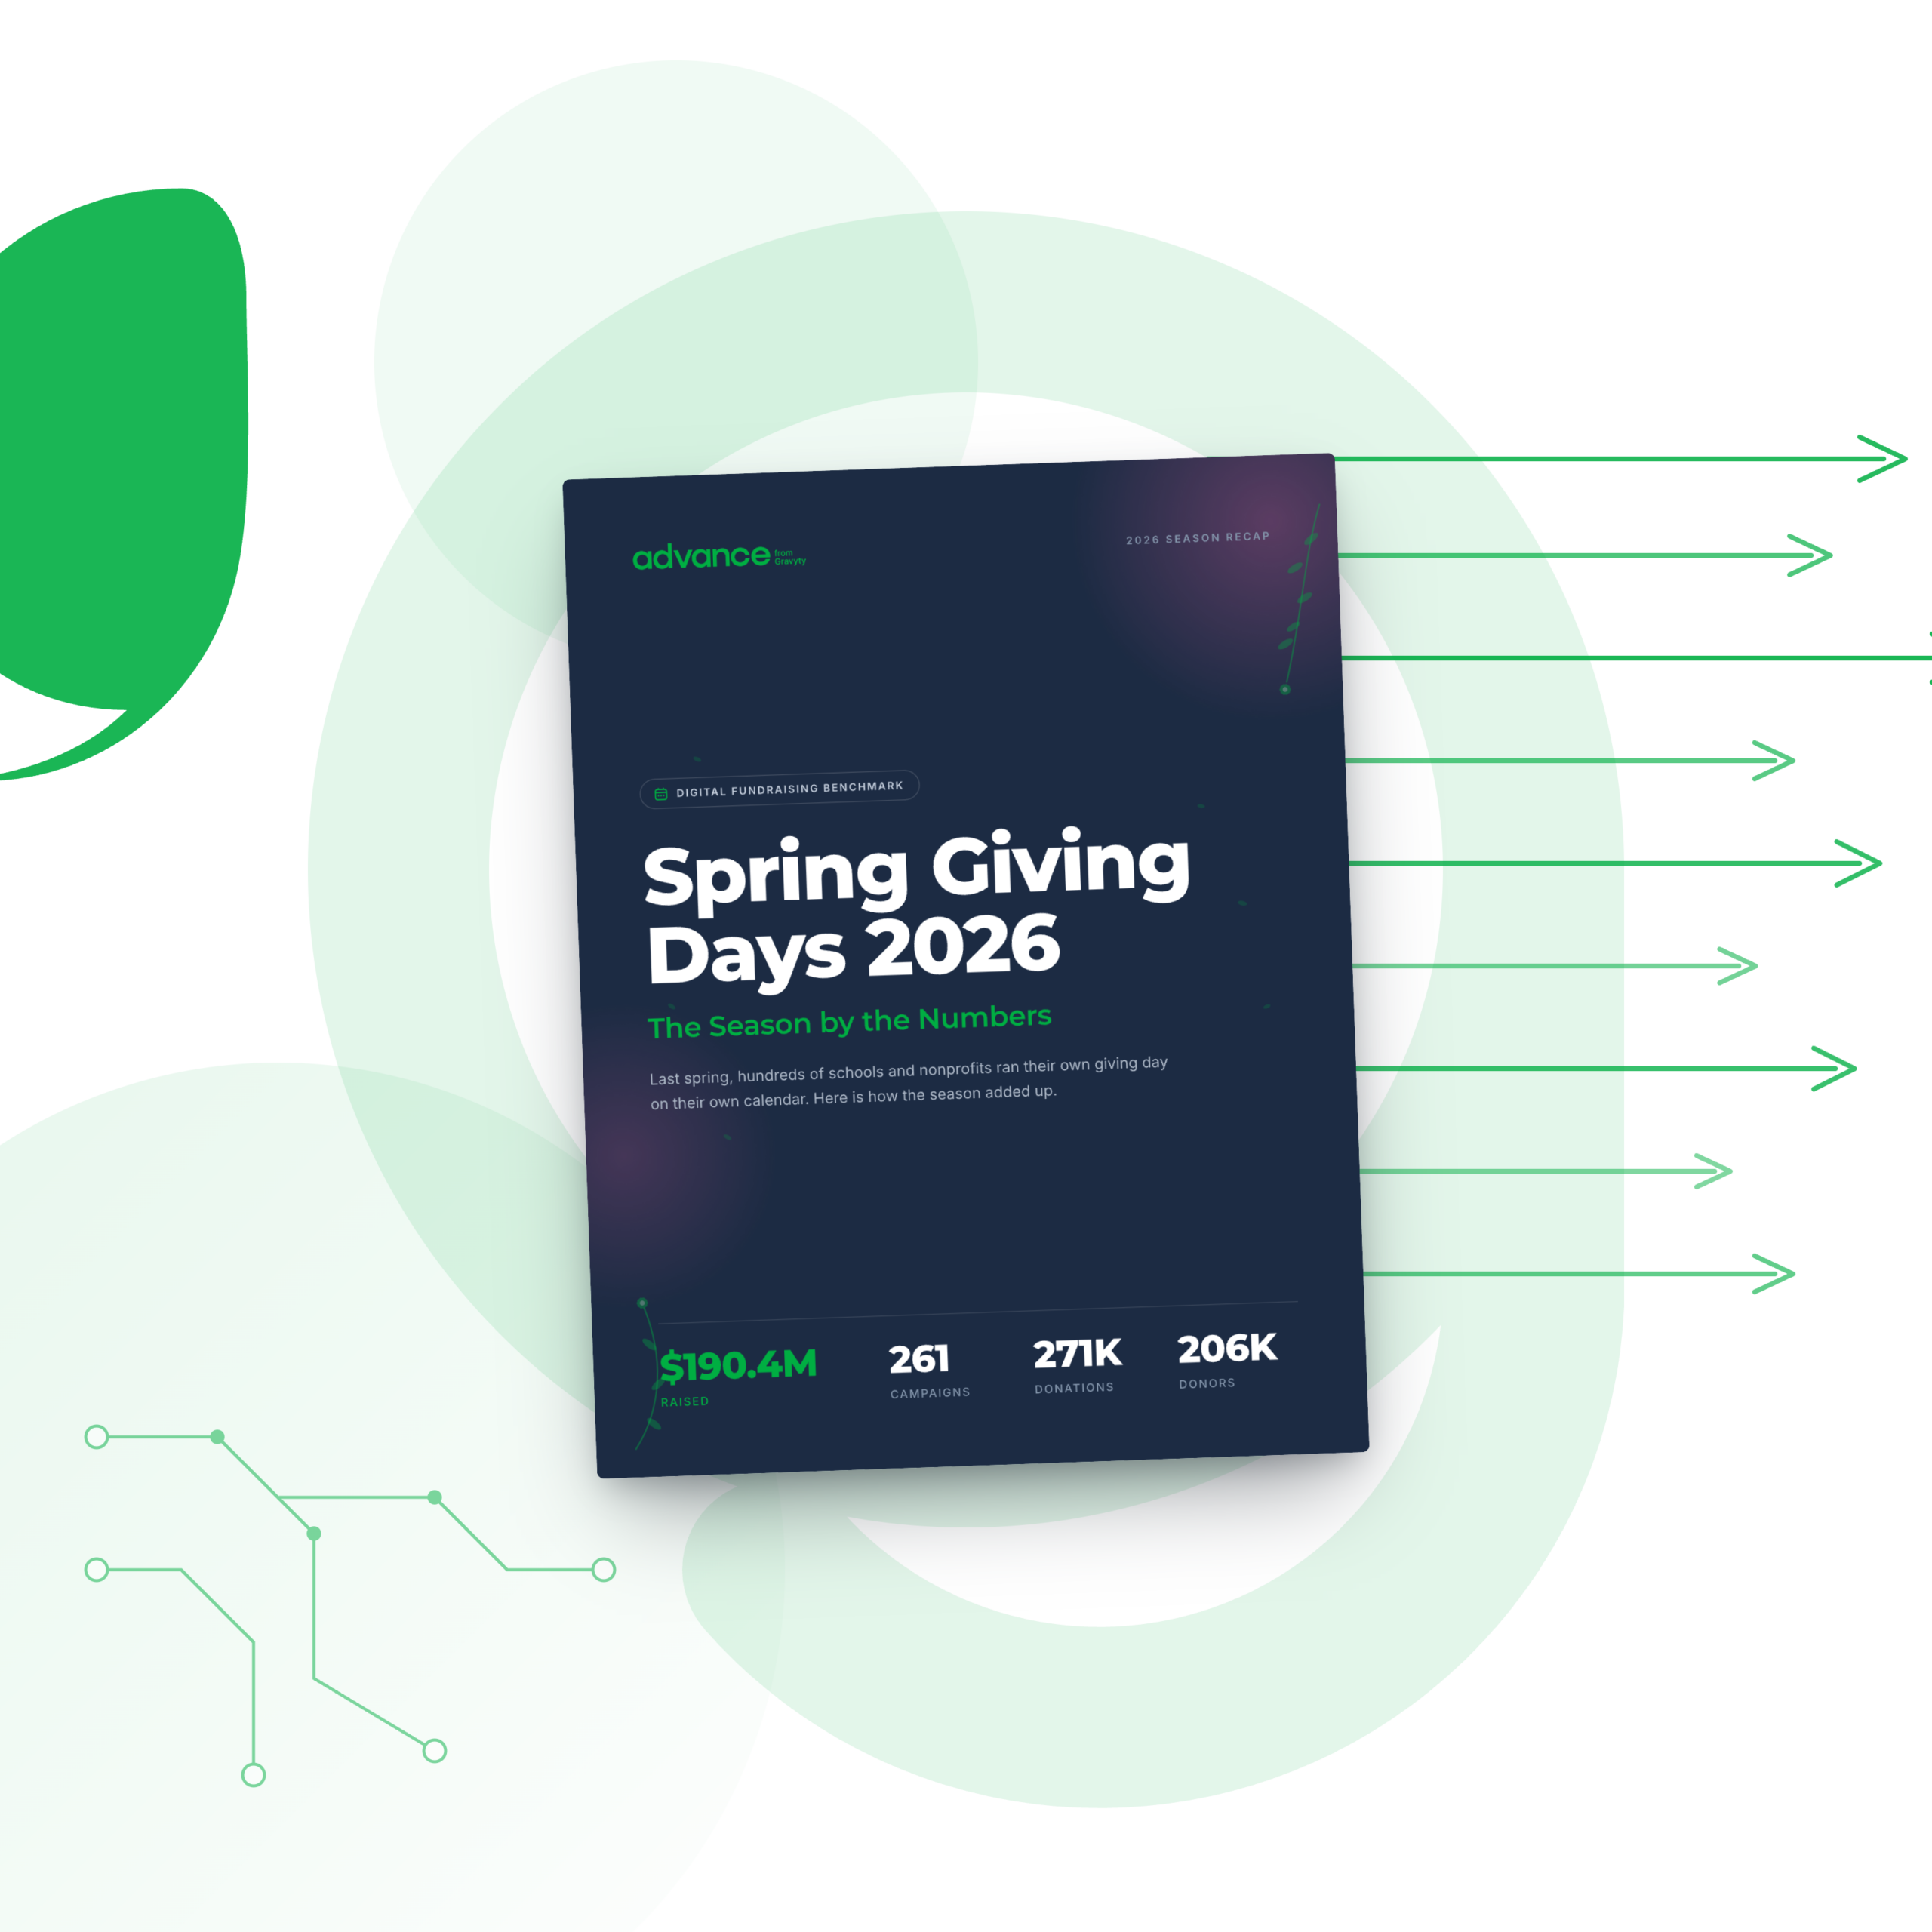
Spring Giving Days 2026: A Digital Fundraising Benchmark Report
Advancement teams raised $190.4 million across 261 spring giving days this year. No shared date, no single national moment, just institution after institution choosing what worked for them.
Every campaign in this report ran on its own calendar, but the patterns underneath were remarkably consistent: the same drop-off point, the same peak giving hour, the same handful of campaign types pulling in the biggest gifts. This benchmark shows where those patterns landed in 2026 and what they mean for the giving day you’re already planning for next spring.
What’s inside:
Why $106 million of this spring’s $190.4 million came through digital giving alone, and what that 56% share means for teams still leaning on mail and phone asks
A full breakdown of the donor funnel, including the single step where 31% of donors drop off, and the 6.5-hour average gap between starting a gift and finishing it
The exact peak giving hour by time zone, and how to stagger reminders across it instead of sending everything in the morning
How institutions ranging from a 4,400-cadet service academy to a 55,000-student flagship all landed on this year’s leaderboard
A four-part playbook for closing the payment gap, timing asks to the giving surge, recovering same-day drop-offs, and making every ask more tangible before next spring
The data makes the case that how a giving day is built, not just when it runs, is what decides how much it raises.